T-test,
(Students t-test): This simple statistic allows you to compare whether your
data are significantly different from some expected value. For example,
you measure water temperature in Hennington pond every day at noon for the month
of September to test the hypothesis that September 2000 has been significantly
hotter for campus aquatic systems than past years. Fortunately, you have access
to daily water temperature data from last September, and from every September in
the 1990s. You set up your spreadsheet with 2000 data paired in rows with 1999
data, each row being the measurement from the same day in September. A t-test
will tell you whether 2000 was significantly hotter than 1999. Replace the 1999
data with the means of daily water temperatures for each September day for the
1990s, and you can see if September 2000 has been significantly hotter than the
1990s in general. You can also use t-tests to compare 1 dataset to another by
pairing them together—this is called a paired t-test, ironically enough!
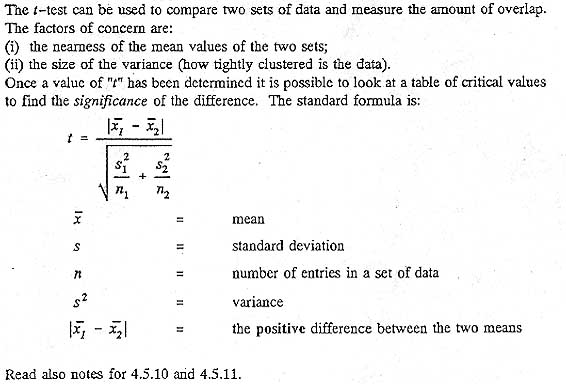
The t-test can be
used to compare two sets of data and measure the amount of overlap. Students
will not be expected to calculate values of t.
( The
t-test should only be used on normally distributed data, ideally with large
samples (>30 measurements per set of data) and the value of t should be compared
with the critical value at # degrees of freedom. For sample sizes <30 the value
of t is only approximate and the degrees of freedom is n1+ n2 - 2. If t >
critical value then it is possible to reject the null hypothesis)