Offline Mobile Map Data Plotting App for Google Android and Apple iOS
Our Offline Mobile Map Data Plotting App will shortly be available for download on Google Android and Apple iOS mobile operating systems. The app is designed for offline (no wifi) field data collection using smart phones and tablets with a level of accuracy that meets the needs of most student projects. Getting within 10 metres is usually more than adequate to map and plot a range of geographical data. Users can create data maps in the field, using geo-located map markers supporting colour shading, text, numerical (decimal) data and images. Editable worksheets allowing multiple data inputs for any location are provided in the app as an optional feature. Maps may be downloaded containing geo-located markers, visible data values, text and images.
The app is designed to be easy to use and self-explanatory. For most students, a short demonstration is all that is required to be able to use it independently in the field for the first time.
We provide OpenStreetMap download links for specific field study sites for opening in the app. The app supports OpenStreetMaps for any location. It is not limited to our region in Spain.
Offline Mobile Map Data Plotting App Features
- Open/delete a previously imported map area or import a new one from a link provided.
- Your current location is visible on the map, and is updated whenever you move.
- Zoom in and out (up to 8 zoom levels).
- Setup a data categories table. The application has default data categories with coloured map markers. These categories may be edited, added to or removed.
- Use worksheets in the app to record and display a wide range of data at any location. New worksheets can be generated and edited.
- Select a data category marker and insert data (colour, text, numerical, images) using the 'Insert Data' button. Inserted data appears on the map above the marker, or for worksheets, images and text descriptions, show when the marker is clicked. Markers may be located on the map without inserting data.
- Applying a data marker drops it into the centre of the map to be dragged to your current location.
- The map may be saved and exported with or without location markers or as an html page for desk top use or interactive web page presentation.
- Overlays can be created by selecting the 'Export Markers Only' option, with transparent map background. Map edge markers are provided to align overlays.
- The map image with location markers and visible data inputs can be downloaded from Android operating systems (or from iTunes for iOS) for direct insertion in a document, printing, or the creation of overlays and further processing.
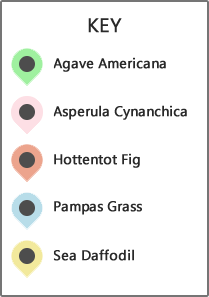
An example of maps of invasive plant species at the Gavà sand dunes created by a student from Grey Coat Hospital School in March 2018 are shown below. The maps can be dragged and clicking on the map markers displays data and images.
Source: Emily, Grey Coat Hospital School, 29 March 2018
Offline Mobile Map Data Plotting App Help and FAQ
Offline Mobile Map Data Plotting App Screenshots

