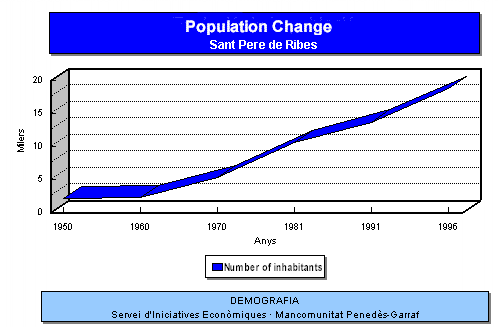
Population Change
| Years |
Number of inhabitants
|
Annual rate of change
|
| 1985 |
11,499
|
--
|
| 1986 |
11,695
|
1.70
|
| 1987 |
11,974
|
2.39
|
| 1988 |
12,589
|
5.14
|
| 1989 |
13,258
|
5.31
|
| 1990 |
13,991
|
5.53
|
| 1991 |
13,662
|
-2.35
|
| 1992 |
15,373
|
12.52
|
| 1993 |
16,513
|
7.42
|
| 1994 |
17,391
|
5.32
|
| 1996 |
18,805
|
8.13
|

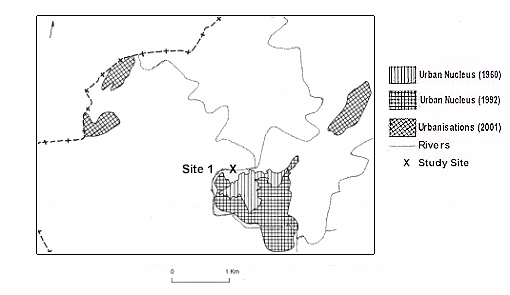
Urban Growth 1960 - 2001

Occupational Structure Changes 1986 - 1991
| |
Municipality |
Region |
Catalunya |
| Sector |
1986 |
1991 |
1986 |
1991 |
1986 |
1991 |
| Agriculture |
4.5 |
3.0 |
4.4 |
3.2 |
4.9 |
3.7 |
| Industry |
32.5 |
28.5 |
36.4 |
30.2 |
35.7 |
36.2 |
| Construction |
17.5 |
19.9 |
9.6 |
12.4 |
5.3 |
8.2 |
| Services |
43.3 |
48.6 |
45.8 |
54.2 |
45.6 |
51.9 |
| Other |
2.2 |
. |
3.8 |
. |
8.5 |
. |
| Total occupations |
3,284 |
4,920 |
21,029 |
27,213 |
1,839,097 |
2,255,430 |
|