Priorat: Hypothesis Testing
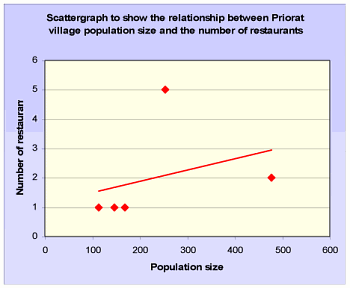
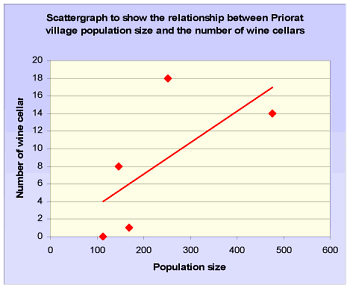
The relationship between population size and the number of restaurants or wine cellars in each of the Priorat study villages can be presented as a scattergraph and tested using Spearman's Rank Correlation Coefficient.
 |
 |
|
Restaurants and Wine Cellars in Priorat |
||||||||
| Village | Population | Rank Pop | Restaurants | Rank Rest | d² | Cellars | Rank Cell | d² |
| Pradell | 169 | 1 | 1 | 1 | ||||
| Gratallops | 253 | 5 | 18 | 18 | ||||
| Lloar | 113 | 1 | 0 | 0 | ||||
| Torroja | 147 | 1 | 8 | 8 | ||||
| Porrera | 477 | 2 | 14 | 14 | ||||
| Sd² | ||||||||
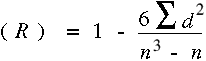
- Calculate the coefficient (r²) using the formula below. The answer will always be between 1.0 (a perfect positive correlation) and -1.0 (a perfect negative correlation).
When written in mathematical notation the Spearman Rank formula looks like this :
 |
A number of further relationships may be explored from population and services data, including the positive correlation between the percentage born in the rest of Spain and the number of wine cellars found in each Priorat town.