Geography
Biology
Geology
Business Studies
 
Expand All  |  Collapse All
 
GCSE
Animations
Forum
Google Compass
Google Earth
Google Street Maps
OS Maps Compass
Coursework
Coursework Helpline
El Raval
Planning
Designing
Introduction
Data Collection
Data Presentation
Analysis
Organisation
Edexcel A Exam
Syllabus
Assessment Scheme
Assessment
Core Paper
A1 Physical
A2 Human
A3 Economic
A4 Natural World
Option Paper
B5 Environment
C8 Urban
Revision
Core Paper
A1 Physical
1.1 Rivers
New item
1.2 Glaciation
New item
1.3 Coasts
New item
A2 Human
2.1 Pop Change
DTM
Change
2.2 Pop Structure
Dependency
Ethnic
LEDC/MEDC
Rural/Urban
2.3 Settlements
LEDC Land Use
MEDC Land Use
Site & Situation
Urban Zones
Zomba
A3 Economic
3.1 Sectors
Structure
3.2 Farming
Systems
Factors
EU
Agribusiness
Costa Polythene
LEDC
3.3 Industry
Location
Location Change
High Tech
Multiplier Effect
Formal/Informal
TNC
A4 Natural World
4.1 Weather
Air Masses
Frontal Rain
Relief Rain
Anticyclones
Synoptic Charts
4.2 Climate
Climate Factors
Climate Types
4.3 Forests
Distribution
Adaptation
Case Study
Option Paper
B5 Environment
Barton on Sea
Causes & Effects
Management
Evaluation
Rhine Floods
Background
Causes
Effects
Management
Evaluation
Farming
East Anglia
Causes & Effects
Evaluation
Sahel
Causes & Effects
Evaluation
Exploitation
Doņana
Causes & Effects
Issues
Rain Forest
Timber Extraction
C7 Tourism
Growth
Multiplier Effect
Causes
Classification
Impact
Impacts
Machu Picchu
Attractions
Impacts
Groups Affected
Sitges
Attractions
Impacts
Groups Affected
Management
Contrasts
Machu Picchu
Attractions
Management
Attitudes
Maldives
Attractions
Management
Attitudes
Yosemite
Attractions
Problems
Management
Attitudes
C8  Urban Areas
Barcelona
Inner City
Urban Sprawl
Management
Pollution
Causes
Management
Attitudes
Sao Paulo
Management
Glossaries
Coasts
Farming
Glaciation
Industry
Population
Rivers
Settlement
Urban
Weather
Tests
Air Masses
Anticyclones
Coasts
Economic Change
Glaciation
Grid References
LEDC Urban Land Use
Map Bearings
Map Reading
Population Change
Population Structure
Rainforest Management
Rainforest Vegetation
Rivers
Weather at a Front
Test Users Online
Active Test Users
Change Name
Chat
Your Data
Your Data Log
Other Support
Classroom Support
Classroom Support
Coursework Examples
Coursework Helpline
Site Data
Password Protection
Extended Learning
A Level
Geo Factsheets
Google Compass
Map Reading
Year 7
Year 8
Year 9
Fieldwork
Data presentation
Methodology
Sampling
Techniques
Geography Links
Geo Factsheets
Web Links
Test Support
Capital Cities
Describing Places
Glossaries
Google Compass
Map Reading
Open or Free Text
Test Troubleshooting
Using a Compass
Home Page
May 23, 2013
Availability | Prices 2013 | Prices 2014
 

Population Structure

Population structure can be shown as a population pyramid, see diagram below:

U.K. Population Pyramid 1994

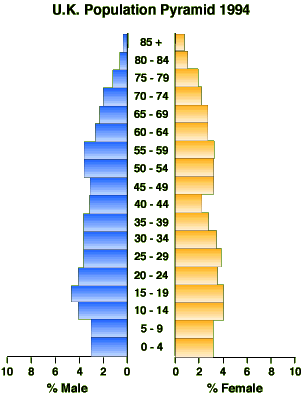
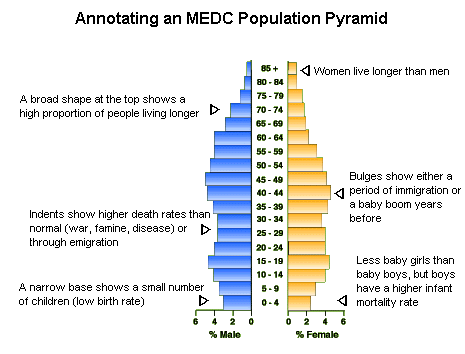
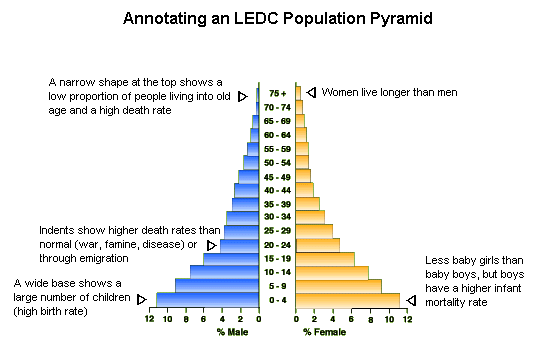
Features of a population pyramid.

  • Population is divided into 5 year age groups.
  • Population is divided into males and females.
  • The percentage of each age /sex group is given.
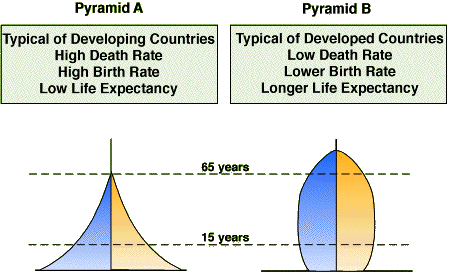
Typical pyramids

Typical Pyramids


MEDC/LEDC Occupational Structures
  Primary Secondary Tertiary
MEDC Very low. Machines have largely replaced human labour on the farms. Low. Automation is increasingly replacing human labour in factories. Globalisation is leading to a shift of manufacturing jobs to the NICs. High. Large numbers are employed in education, health, administration and the knowledge economy
LEDC Large primary sector (farming). Exports are usually primary commodities. Low. Tariff barriers imposed by the trading blocs such as the EU prevent the export of cheap manufactured products. The domestic market is very small. Large service sector. Many employed in the informal economy.
NIC Shrinking primary (farming) sector. Secondary sector is large and growing (transnationals). Small but growing tertiary sector to serve the needs of the transnationals
 
  Copyright © 2013 All Rights Reserved Barcelona Field Studies Centre S.L.  
Page update 5/05/13