Create a Box Plot or Box and Whisker Chart
Box plots or box and whisker charts are a good way to display a range of information about your data sample. These plots contain the range, interquartile range, mean, median, lower value, upper value, lower quartile, upper quartile and standard deviation. Box plots or box and whisker charts can be made for different sample sets to compare distributions.
Enter two data sets in the calculator below. Click the 'Calculate' followed by 'Create Box Plot' buttons and your selected box plot option will open in a new window. A menu appears above the box plots offering several options, including downloading an image of the data presentation.
Box Plot or Box and Whisker Chart Creator
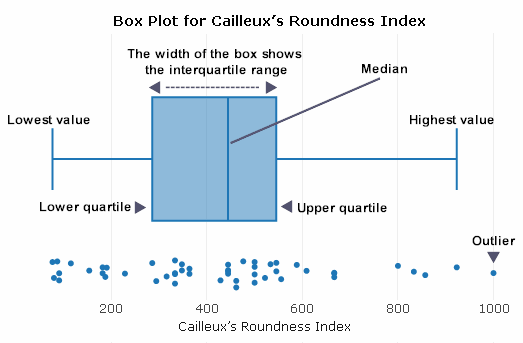
An annotated example of Cailleux's Roundness Index data from a river sampling location is presented below using box plots:

The interquartile range is a measure of variability, based on dividing a data set into quartiles. It contains the middle 50% of a distribution and is a robust measure of statistical dispersion. It can also be used to find outliers in data.

