Minimum Sample Size Calculation
The larger the size of the sample, the greater is the probability that it accurately reflects the distribution of the parent population. The example below shows how many pebble long axes are required to be measured at a beach site to obtain an average (or mean) at the 99% confidence level. The formula uses the standard deviation (the measure of the spread of data around the mean).
What is the expected pebble long axes size distribution?
There are, as is well known, lies, damned lies and statistics. And within statistics there is the bell curve. This is the shape of the frequency distribution one gets when conducting measurements of just about anything in the natural world.
It first came to prominence in the early nineteenth century when Adolph Quetelet, the Belgian Astronomer Royal, collected data on the chest measurements of Scottish soldiers and the heights of French soldiers, and found that when both sets of measurements were plotted they tended to cluster in a symmetrical shape around a mean. Or, less technically, most soldiers were in a height range fairly close to the average. The bell curve became so ubiquitous in measurements of natural phenomena that it was eventually christened the 'normal distribution', and it has conditioned our thinking about statistical data ever since.
The example below simulates how the random distribution of dropping balls creates a bell-curve. At first there does not seem to be any pattern but after a few minutes the stacks conform to the superimposed curve

|
| Randomly dropping balls create a normal distribution curve (bell curve) |
What is the standard deviation?
The standard deviation is a statistic that tells you how tightly the pebbles sizes are clustered around the mean. When the sizes are tightly clustered and the distribution curve is steep (see graph below), the standard deviation is small. When the examples are spread apart and the distribution curve is relatively flat, that tells you that there is a relatively large standard deviation.
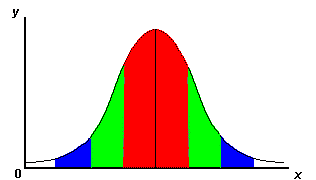 |
Normal distribution curve (bell curve)
|
Key to graph colours above |
|||||
| Colour | Standard Deviation | % of Population | |||
|
|
One standard deviation away from the mean in either direction on the horizontal axis | 68% | |||
|
|
Two standard deviations away from the mean | 95% | |||
|
|
Three standard deviations away from the mean | 99% | |||
Why is this useful?
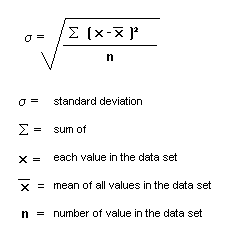
Smaller standard deviations reflect more clustered data. More clustered data means less extreme values. A data set with less extreme values has a more reliable mean. The standard deviation is therefore a good measure of the reliability of the mean value. The formula is as follows:
 |
Is there an easy way to calculate it?
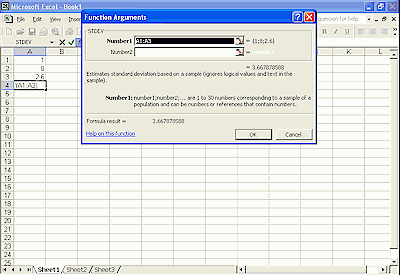
The Microsoft Excel programme will automatically calculate the standard deviation and mean for a set of data listed in a spreadsheet column.
Method:
- List data set in a single column
- Click on the empty cell below the last data item
- Open INSERT menu > FUNCTION > STDEV > click OK
- The standard deviation is then shown and will appear in the empty cell.
- The excel screen example below is for a data set of 3 items
 |
Example
The standard deviation for a pebble data set is shown below:
|
||||||||||||||||||||||||||||||||||||||||||||||||||||||||||||||||||||||||||||||||||||||||||||||||||||||
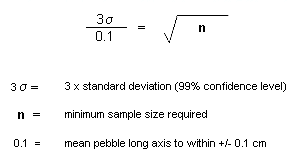
A 99% sample size confidence level with a mean pebble long axis within +/- 0.1cm is calculated using the following formula:
|
i.e. 11.43 = 114.3 n= 114.3² Minimum sample required = 13,064 |
The time taken to measure over 13,000 pebbles suggests it is better to accept a lower level of confidence, and at the 95% level, with a mean pebble long axis within +/- 0.5 cm, a sample size of 30 is still inadequate. This is calculated as follows:
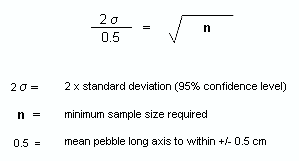
i.e. 7.62
0.5
= 15.24
n= 15.24²
Minimum sample required = 232.26
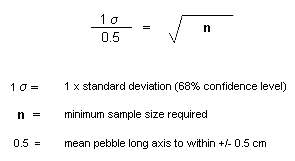
You may, given time constraints, have to accept a 68% level of confidence, with a mean pebble long axis within +/- 0.5 cm. The minimum sample size is calculated as follows:
|
i.e. 3.81 = 7.62 n= 7.62² Minimum sample required = 58.06 |
It is therefore necessary to measure a minimum of 58 pebble long axes, given the pilot data at this site.

