Urban Sampling Techniques
WHY DO WE NEED TO SAMPLE?
The simple answer is to save time having to measure everything, a very lengthy exercise called a census. If we want to know what kind of social, environmental or economic changes are happening in a particular urban area, it is usually impossible to go and count or measure the total number of items under consideration, known as the population.
This problem is usually solved by taking a number of samples from within the area.
REPRESENTATIVE ZONES
It is necessary to ensure that these samples are representative of the urban area in general. In order to be reasonably sure that the results from the samples do represent the different characteristics of the urban area as closely as possible, careful planning beforehand is essential. At least four different representative zones can be identified in the El Raval inner city district of Barcelona. These representative zones differ from each other in some or all of their social, economic and environmental characteristics.
SAMPLE SIZE AND SHAPE
The usual sampling unit is a quadrat or square area. The purpose of using a quadrat is to enable comparable samples to be obtained from areas of consistent size and shape. It does not really matter what shape of quadrat is used, provided it is a similar sized sampling unit and its shape and measurements are stated in any write-up.
PROBLEM WITH SIMILAR SIZED SAMPLING UNITS
- Does not take into account variations in street density. For many urban studies, the primary data collection is based on data collected in the public street and not the area as a whole. One solution is to base the size of the sampling unit on street length or street area.
MINIMUM SAMPLE SIZE
The size of the sample will usually be dictated by the time availability. The larger the sample, the more likely it is to give a true picture of the population you are sampling.
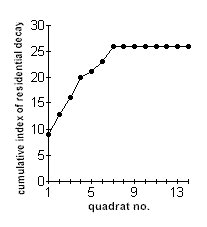
The minimum number of samples which should be taken to be truly representative of a particular area, can be calculated by graphing the number of features recorded, as a function of the number of samples examined.
 The
figure at the left is an example of this, obtained from a survey of residential
decay in an area of El Raval, Barcelona. The first sample gave an index score of
9. With the second sample, the index had increased to 13. After 5 samples had
been examined, the cumulative index had risen to 21. By the time 7 samples had
been taken, the index had stabilised. At this point, further sampling is
becoming unnecessary. This graph therefore shows us that for this particular
representative area, we need to undertake at least 7 samples. Further sampling
beyond this will merely waste time and duplicate results.
A statistical technique is also available that calculates the minimum sample size required, depending upon how reliable you wish your data to be. This makes use of the standard deviation of your sample data. The standard deviation is a measure of the spread of your data from the mean (or average). Two sets of data can have similar means, but very different spreads. The data set with the smallest spread is the more reliable of the two. As your sample size increases, the spread around the mean becomes smaller, as does the standard deviation, and your results become more reliable.
AVOIDING BIAS
One problem with sampling is the tendency to work in the most accessible area or the area you feel most comfortable with. Your selection of sampling zone is therefore biased and your results will not be reliable. This means another researcher undertaking a similar study may get very different results to yours. It is this need to be reliable that lies at the heart of sampling methods.
STATISTICAL TECHNIQUES
There are statistical techniques available that tell you how reliable your work is. The techniques involve formulae that show how close your sampled result is to the result you would obtain if you measured everything.
SAMPLING METHODS
There are three main sampling methods that help to avoid bias in the selection of your sampling sites:
- Random sampling
- Systematic sampling (which includes line transects)
- Stratified Sampling
1. RANDOM SAMPLING
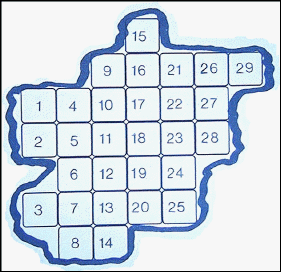
Random sampling is usually carried out when the area under study is very large, or there is limited time available. When using random sampling techniques, large numbers of samples/records are taken from different positions within the area. A numbered grid should be overlaid over a map of the area. A computer generated random number table is then used to select which squares to sample in. For example, if we have mapped a representative zone in El Raval , and have then laid a numbered grid over it as shown below, we could then choose which squares we should sample in by using the random number table.

A numbered grid map of an area to be sampled
The advantage of using random numbers is that no human is involved in the selection process.
2. SYSTEMATIC SAMPLING
Systematic sampling is when samples are taken at fixed intervals, (e.g. every tenth building), usually along a line. This normally involves doing transects, where a sampling line is set up across areas where there are clear changes. For example you might use a transect to show how gentrification or the price of a convenience item changes with increasing distance from a zone of inner city redevelopment.
Line Transect Method
A transect line is laid across the area you wish to study. The position of the transect line is very important and it depends on the direction of the environmental gradient you wish to study. It should be thought about carefully before it is placed. You may otherwise end up without clear results because the line has been wrongly placed. For example, if the area of redevelopment was wrongly identified in the example given above, it is likely that the transect line would be laid in the wrong area and the results would be very confusing.
A line transect is carried out by drawing the transect line along the gradient identified. For example, the price of a convenience item, e.g. a can of coca cola, may be recorded along the whole length of the line. This is called continuous sampling. Alternatively, the presence, or absence of a particular service or feature at each marked point, (e.g. every 100 metres), may be recorded. This is called systematic sampling. Other factors that could affect your results, such as the time of day or the type of retail outlet, can also be inserted onto the profile.
Belt Transect Method
This is similar to the line transect method but gives information on abundance as well as presence, or absence of a particular urban feature. It may be considered as a widening of the line transect to form a continuous belt, or series of quadrats.

In this method, the transect line is laid out across the area to be surveyed and a quadrat is located on the first marked point on the line. The features inside the quadrat are then identified and their abundance estimated.
Quadrats are sampled all the way down the transect line, at each marked point on the line, or at some other predetermined interval (or even randomly) if time is short.
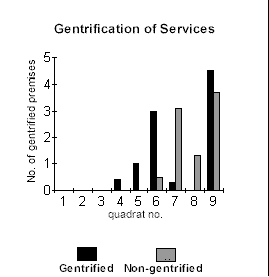
An example of the type of results that can be obtained from a belt transect survey is shown in the figure to the right.
This figure illustrates the distribution and abundance of gentrified services along a belt transect line. The oldest area of redevelopment in this example would be quadrat 6, with gradients falling to the periphery at quadrat 4. Quadrats 1-3 are areas with no services. Quadrat 9 is an area of very recent radical redevelopment, where gentrification is consolidating.
3. STRATIFIED SAMPLING
Stratified sampling is used where there are small areas within a larger study location which are clearly different. For example, an area with more elderly and very young people. We would therefore make sure that our sample included a representative proportion of the elderly and very young. Sampling would still be carried out either randomly, or systematically within each separate 'stratum' identified. This recognizes major differences within communities before sampling begins.
Stratified sampling has the advantage that it helps to reduce any bias which might arise if samples were chosen completely at random. The problem is identifying in advance what the strata (such as age divisions) should be.
Adapted from Ecological Sampling Techniques presented by Offwell Woodland & Wildlife Trust
