Kite Diagrams or Chart Creator for Species Abundance and Distribution
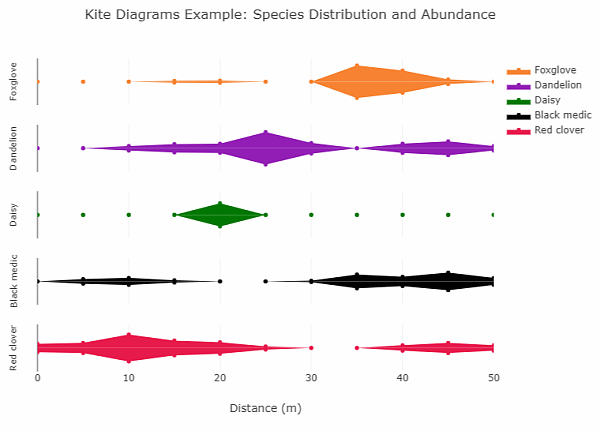
Our Kite Diagrams or Chart Creator makes a visual representation of changes in abundance and distribution of species along a transect. This gives a graphical summary in a way that is easy to see and assists in the analysis of the abiotic factors and biotic processes that affect an ecosystem.
Enter your species data and number of transect sampling points in the calculator below. Select the type of kite diagrams required (horizontal or vertical) and click the 'Calculate' button to create the kites. The 'Open Kite Diagrams' button will open the kites in a new window. Hover over the kite images to display the data. An image of the kite diagrams may be saved using the 'Download Image' button at the top of the page. The data used to construct them are displayed with the 'Print Data' button.
The 'Total Cover' button displays the percentage total species cover at each sampling point.
Each species may be individually labelled with the 'Label Species' button. The 'Customise' button enables the customising of your kite diagrams title, kite colours and the X-Axes range.
Species data entered are validated for a maximum of 100% total species at each sampling location. Transect distance data are validated to assist cumulative accuracy.
Kite Diagrams Creator for Species Abundance and Distribution
Create kite diagrams to display changes in species abundance and distribution along a transect
This Kite Diagrams Creator displays the individual percentage ground cover of species at sampling points along a transect line, with a maximum of 100% cover at each location for all observed species combined. Our Kite Diagrams Maker displays the percentage changes in frequency and distribution of individual data entities across all sampling points, with each data entity totalling 100% for the entire transect.
 Kite Diagrams Example created with our Kite Diagrams Maker |
Kite Diagrams Species Distribution and Abundance Example
Percentage Total Species Cover Example
Kite Diagrams Maker For Any Data Entities
Kite Diagrams Example for Any Data Entities
Proportional Circles Chart Maker
Proportional Circles Chart Example

