Polar Scatter Chart Creator
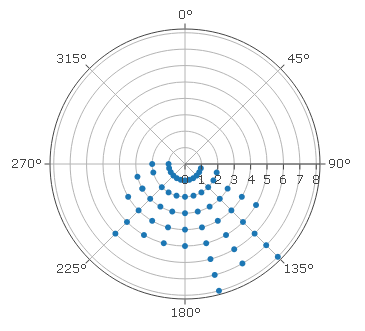
This Polar Scatter Chart constructor creates a circular chart to display scatter plots that contain direction and magnitude variables. The chart displays the 360 degrees of a circle or compass points North, East, South, West and their intermediate directions. Individual data values can be plotted as magnitude or number order (1,2,3 etc.) along their associated direction axis. The example shown below was created by plotting data with the same orientation value in number order.
Polar Scatter Charts are a powerful way of displaying raw fieldwork data containing amount and direction values. They can be used, for example, to display the number of pebbles orientated along a particular compass bearing, or the number and direction that cirques or corries face.
Enter your data in the calculator below. Click the 'Calculate' followed by 'Create Polar Chart' buttons and your polar chart will open in a new window. A menu appears above the chart offering several options, including downloading an image. Hover over the chart to display the data.
Polar Scatter Chart Maker

Polar scatter chart example for pebble long axis orientations, Santa Margarida beach SW, Sitges.
Location: storm beach. Sample size: 60

