Donut (or Doughnut) Chart Creator
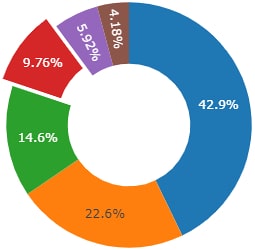
This Donut Chart Maker converts raw data to percentages to create a circular statistical graphic with a hollow centre. It is divided into proportional slices or sectors with the arc length of each slice proportional to the quantity it represents. The sectors can be unsorted or sorted clockwise by size, with colours maintained in the sorting process.
Enter your raw or percentage data in the calculator below. Click the 'Calculate' followed by 'Create Donut Chart' buttons and your donut chart will open in a new window. A menu appears above the chart offering several options, including downloading an image. Hover over the sectors to display the data. Use the 'Customise' button to add a Donut Chart title, centre text and hover label. Click the 'Explode' button to detach a sector from the donut chart for emphasis.


