Cailleux Roundness Index Calculator with Box Plot Analysis
Calculate the Cailleux Roundness Index for each pebble or sedimentary particle and create a box plot to analyse the results.
The Cailleux Roundness Index (R) measures the radius of curvature (r) of the sharpest corner of a particle in relation to its longest dimension or long axis (l) using the formula:
![]()
The index was developed by French geographers Cailleux and Tricart in 1963. Interestingly, the French word 'cailleux' means 'pebbles'.
The size and shape of all particles depend initially upon the composition of the rock from which they originated and the weathering and transportation processes to which they have been subjected. Roundness refers to the amount of wear displayed. The degree of wear is closely related to the hardness of the geology, the distance the particle has been transported by running water and the type of environment (e.g. river, coastal, glacial) in which it is deposited. As the distance of transport increases, variability of roundness within a sedimentary deposit tends to decrease, and particle shapes become more rounded through the processes of attrition and abrasion.
Roundness values lie between 0 and 1,000 and apply to a limited size range as the radius is likely to be a function of particle size itself. A perfectly spherical pebble has a roundness Index of 1000. The lower the Roundness Index is, the more angular the pebble.
Enter your particle radius and long axis in the calculator below. Click the 'Calculate' button to calculate your box plot and mean values. Select the type of box plot required and the 'Open Box Plot' button will open your box plot in a new window. A menu appears above the box plot offering several options, including downloading an image. Hover over the image to display the data.
Cailleux Roundness Index
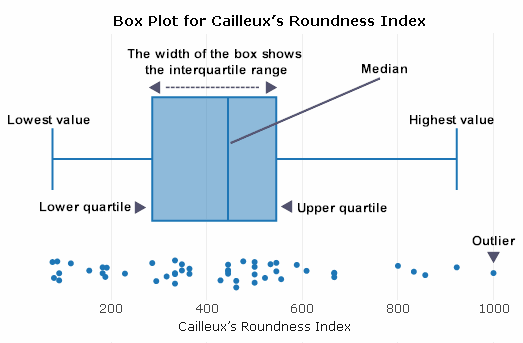
Cailleux's Roundness Index is presented here using box plots. These plots contain the range, interquartile range, median, lower value, upper value, lower quartile and upper quartile. Box plots can be generated for different sample sets to compare distributions. An annotated example is shown below:

The interquartile range is a measure of variability, based on dividing a data set into quartiles. It contains the middle 50% of a distribution and is a robust measure of statistical dispersion. It can also be used to find outliers in data.

