Stacked Bar Chart Maker
Make stacked bars to show changes and trends for multiple categories of data. Our Stacked Bar Chart Maker is free to use and no account or login is required.
A stacked bar chart displays bars divided into multiple segments or data categories. The height of each bar represents the cumulative total value of multiple categories of data, hence the term 'stacked chart' for this type of data presentation technique. Stacked bars show the overall trend in the data and the causes of changes underlying the trend. This assists in the analysis of the factors responsible for the changes.
Stacked bar charts are designed to help you simultaneously compare the stacked bar totals and identify changes at the individual data category level that are likely to have the most influence. The indicators suitable for stacked bar charts are those make up the multiple components of a larger accumulated category.
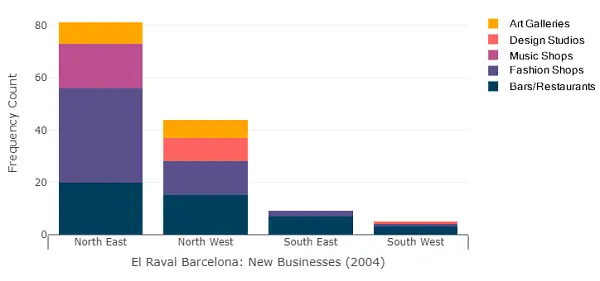
An example below made with this calculator shows changes for new businesses and economic activity in the El Raval district of Barcelona. Five indicators of change have been selected as categories that accumulate to form the stacked bar totals. The data are from fieldwork in 2004, and reflect the impact of the Contemporary Art Museum constructed in the north of El Raval at the time of the 1992 Olympic Games.
Enter the number of data categories and stacked bars in the calculator. Add your data and click the 'Calculate' button. The 'Open Stacked Bar Chart' button will open the chart. Hover over the chart to display the data. An image of the chart may be saved using the camera icon in the toolbar above the chart. The data used to construct the chart are displayed with the 'Print Data' button.
Each data category may be individually labelled with the 'Label Categories' options button. The 'Customise' button opens options to customise the chart title, y-axis title and data category colours.
Stacked Bar Chart or Bar Graph Maker
Make stacked bars to show changes and trends for multiple categories of data.
Horizontal Stacked Bar Chart Example
Percentage Stacked Bar Chart Maker


