Spearman's Rank Correlation Coefficient
The Spearman's Rank Correlation Coefficient is used to discover the strength of a link between two sets of data. This example looks at the strength of the link between the price of a convenience item (a 50cl bottle of water) and distance from the Contemporary Art Museum in El Raval, Barcelona.
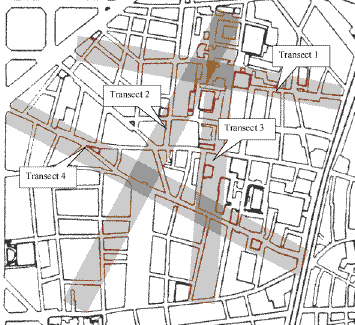
Example: The hypothesis tested is that prices should decrease with distance from the key area of gentrification surrounding the Contemporary Art Museum. The line followed is Transect 2 in the map below, with continuous sampling of the price of a 50cl bottle water at every convenience store.
 |
Map to show the location of environmental gradients for transect lines in El Raval, Barcelona
Hypothesis
We might expect to find that the price of a bottle of water decreases as distance from the Contemporary Art Museum increases. Higher property rents close to the museum should be reflected in higher prices in the shops.
The hypothesis might be written like this:
The price of a convenience item decreases as distance from the Contemporary Art Museum increases.
The more objective scientific research method is always to
assume that no such price-distance relationship exists and to express the null
hypothesis as:
there is no significant relationship between the price of a convenience item
and distance from the Contemporary Art Museum.
What can go wrong?
Having decided upon the wording of the hypothesis, you should consider whether there are any other factors that may influence the study. Some factors that may influence prices may include:
- The type of retail outlet. You must be consistent in your choice of retail outlet. For example, bars and restaurants often charge significantly more for water than a convenience store. You should decide which type of outlet to use and stick with it for all your data collection.
- Some shops have different prices for the same item: a high tourist and lower local price, dependent upon the shopkeeper's perception of the customer.
- Shops near main roads may charge more than shops in less accessible back streets, due to the higher rents demanded for main road retail sites.
- The positive spread effects from other nearby areas of gentrification or from competing areas of tourist attraction.
- The negative spread effects from nearby areas of urban decay.
- Higher prices may be charged during the summer when demand is less flexible, making seasonal comparisons less reliable.
- Cumulative sampling may distort the expected price-distance gradient if several shops cluster within a short area along the transect line followed by a considerable gap before the next group of retail outlets.
You should mention such factors in your investigation.
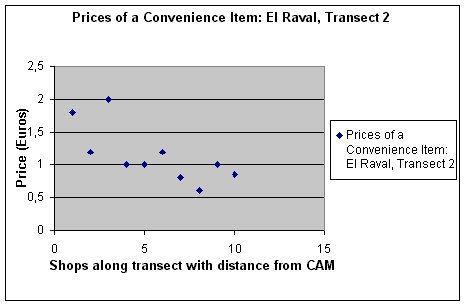
Data collected (see data table below) suggests a fairly strong negative relationship as shown in this scatter graph:
Scatter graph to show the change in the price of a convenience item with distance from the Contemporary Art Museum. Roll over image to see trend line.
The scatter graph shows the possibility of a negative correlation between the two variables and the Spearman's rank correlation technique should be used to see if there is indeed a correlation, and to test the strength of the relationship.
Spearman's Rank correlation coefficient
A correlation can easily be drawn as a scatter graph, but the most precise way to compare several pairs of data is to use a statistical test - this establishes whether the correlation is really significant or if it could have been the result of chance alone.
Spearman's Rank correlation coefficient is a technique which can be used to summarise the strength and direction (negative or positive) of a relationship between two variables.
The result will always be between 1 and minus 1.
Method - calculating the coefficient
- Create a table from your data.
- Rank the two data sets. Ranking is achieved by giving the ranking '1' to the biggest number in a column, '2' to the second biggest value and so on. The smallest value in the column will get the lowest ranking. This should be done for both sets of measurements.
- Tied scores are given the mean (average) rank. For example, the three tied scores of 1 euro in the example below are ranked fifth in order of price, but occupy three positions (fifth, sixth and seventh) in a ranking hierarchy of ten. The mean rank in this case is calculated as (5+6+7) ÷ 3 = 6.
- Find the difference in the ranks (d): This is the difference between the ranks of the two values on each row of the table. The rank of the second value (price) is subtracted from the rank of the first (distance from the museum).
- Square the differences (d²) To remove negative values and then sum them (
 d²).
d²).
| Convenience Store | Distance from CAM (m) | Rank distance | Price of 50cl bottle (€) | Rank price | Difference between ranks (d) | d² |
|---|---|---|---|---|---|---|
| 1 | 50 | 10 | 1.80 | 2 | 8 | 64 |
| 2 | 175 | 9 | 1.20 | 3.5 | 5.5 | 30.25 |
| 3 | 270 | 8 | 2.00 | 1 | 7 | 49 |
| 4 | 375 | 7 | 1.00 | 6 | 1 | 1 |
| 5 | 425 | 6 | 1.00 | 6 | 0 | 0 |
| 6 | 580 | 5 | 1.20 | 3.5 | 1.5 | 2.25 |
| 7 | 710 | 4 | 0.80 | 9 | -5 | 25 |
| 8 | 790 | 3 | 0.60 | 10 | -7 | 49 |
| 9 | 890 | 2 | 1.00 | 6 | -4 | 16 |
| 10 | 980 | 1 | 0.85 | 8 | -7 | 49 |
Data Table: Spearman's Rank Correlation
- Calculate the coefficient (Rs) using the formula below. The answer will always be between 1.0 (a perfect positive correlation) and -1.0 (a perfect negative correlation).
When written in mathematical notation the Spearman Rank formula looks like this :
 |
Now to put all these values into the formula.
- Find the value of all the d² values by adding up all the values in the Difference² column. In our example this is 285.5. Multiplying this by 6 gives 1713.
- Now for the bottom line of the equation. The value n is the number of sites at which you took measurements. This, in our example is 10. Substituting these values into n³ - n we get 1000 - 10
- We now have the formula: R = 1 - (1713/990) which gives a
value for R:
1 - 1.73 = -0.73
What does this Rs value of -0.73 mean?
The closer Rs is to +1 or -1, the stronger the likely correlation. A perfect positive correlation is +1 and a perfect negative correlation is -1. The Rs value of -0.73 suggests a fairly strong negative relationship.

A further technique is now required to test the significance of the relationship.
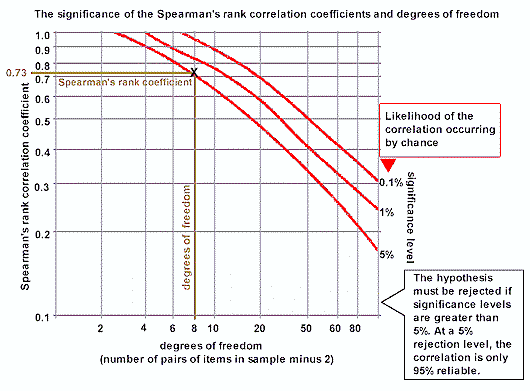
The Rs value of -0.73 must be looked up on the Spearman Rank significance table below as follows:
- Work out the 'degrees of freedom' you need to use. This is the number of pairs in your sample minus 2 (n-2). In the example it is 8 (10 - 2).
- Now plot your result on the table.
- If it is below the line marked 5%, then it is possible your result was the product of chance and you must reject the hypothesis.
- If it is above the 0.1% significance level, then we can be 99.9% confident the correlation has not occurred by chance.
- If it is above 1%, but below 0.1%, you can say you are 99% confident.
- If it is above 5%, but below 1%, you can say you are 95% confident (i.e. statistically there is a 5% likelihood the result occurred by chance).
In the example, the value -0.73 (or +0.73) gives a significance level of slightly less than 5%. That means that the probability of the relationship you have found being a chance event is about 5 in a 100. You are 95% certain that your hypothesis is correct. The reliability of your sample can be stated in terms of how many researchers completing the same study as yours would obtain the same results: 95 out of 100.

Graph of significance levels for Spearman's Rank correlation coefficients using Student's t distribution
- The fact two variables correlate cannot prove anything - only further research can actually prove that one thing affects the other.
- Data reliability is related to the size of the sample. The more data you collect, the more reliable your result.
Click Spearman's Rank Signifance Graph for a blank copy of the above significance graph.
Spearman's Rank Correlation Coefficient Rs and p-value Calculator

