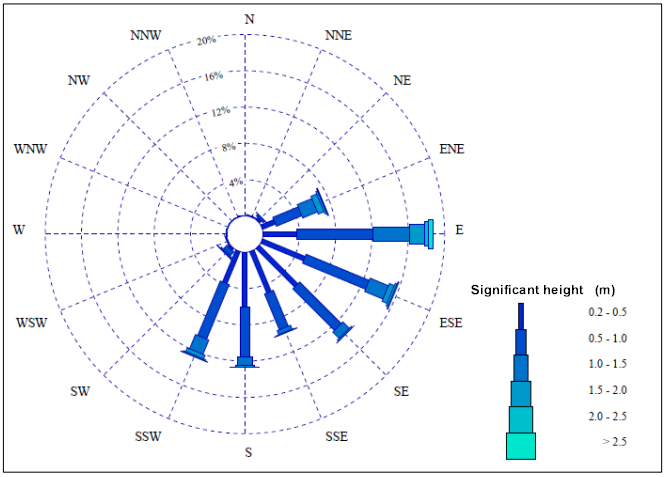
Rose Diagram Example
Rose diagrams are useful in geography fieldwork to analyse data containing magnitude and direction values. They are commonly used to display the direction, strength and frequency of wind or ocean waves, the orientation of the long axes of pebbles and the direction that cirques or corries face.
The example of a Wave Rose below shows annual average wave swell heights, frequencies and directions for the Sitges coast.

Wave rose showing annual average wave swell heights, frequencies and directions for the Sitges (Barcelona) coast. 7.65% calm (0 - 0.2m) (Source: Puertos del Estado, Ministerio de Fomento de España) |
