Map of income per person in Barcelona, street by street (2016)
Barcelona is a city where economic realities vary from street to street. There are some relatively homogeneous districts. There are also districts with strong contrasts between the wealthy and the less well-off separated by a couple of streets. This is confirmed by the 2016 data published the National Statistics Institute (INE), that for the first time reveals the income of the Spaniards street by street.
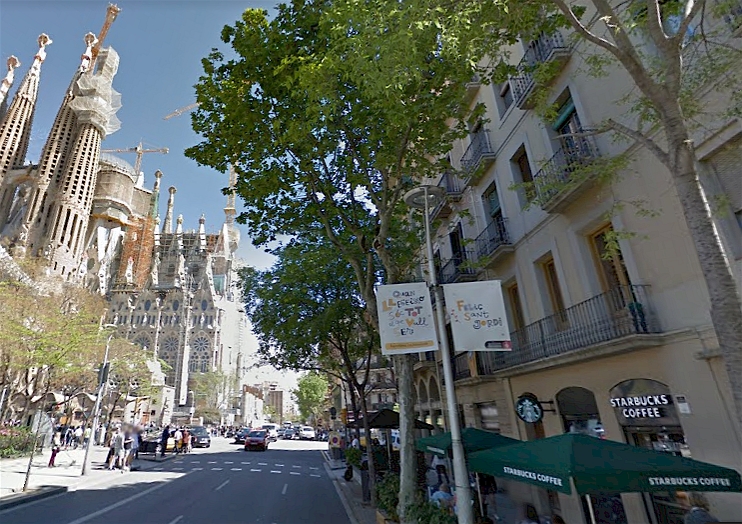
This street by street income data provide a route to a wide range of potential geographical investigations into the causes and consequences of the inequalities. For example, areas of old manufacturing industry and sites close to global tourist attractions (e.g. Sagrada Família) appear to have a negative effect on incomes with consequent higher levels of deprivation.
The richest census district, Pedralbes, lies furthest from areas of old manufacturing industry, and the poorest, Sant Pere Ermengol, lies close to the industrial estates of the Besós river valley. The difference in income between them is very similar to the Catalan average. While those who reside in some streets of El Raval inner city district earn 6,796 euros gross per year, further north in the suburbs of Pedralbes the wealthy residents enjoy a per capita income over four times more. A Pedralbes resident earns on average 29,364 euros per year, almost 2,500 euros per month.
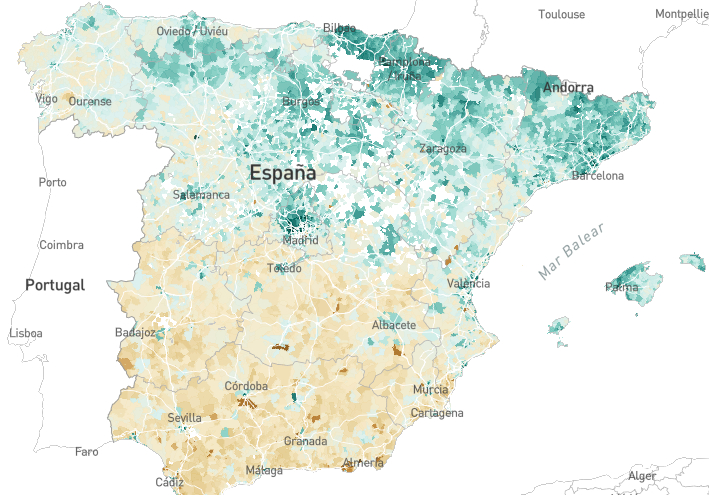
| Map of the income of the Spaniards 2016, street by street (El Pais) |
The area with the greatest deprivation in Barcelona is also one with some of the greatest contrasts. Residents of some streets in la Mina earn less than 5,000 euros per year whereas their neighbours next door in Diagonal Mar earn four times more.
The inner city district of El Raval has strong contrasts between a richer north and a poorer south. There are also marked differences in income between the east and west of the Raval. Within the north of the Raval, some residents enjoy incomes almost double those living just a few streets away, with the Barcelona Museum of Contemporary Art providing a clear dividing wall.
Other areas tend to be more homogeneous, such as the Eixample (17,280 euros per year on average). Here the differences are less marked, but are greatest between those more wealthy residents residing close to the Passeig de Gràcia and Diagonal business districts and those less advantaged living to the left side of the Eixample closer to the former slaughter house and manufacturing industry.
|
|
| Incomes of residents in the streets by the Sagrada Família are lower than those living one street further away |
Catalonia and its contrasts
Less than twenty kilometres and the Collserola hills separate the residents of the richest town of Catalonia from the poorest. The richest town is Sant Cugat del Vallès, located close to the Autonomous University of Barcelona and High Technology Park. Here the residents enjoy an average income of more than 25,000 euros per year. The poorest district is Sant Roc, in the industrial town of Badalona. There the average income per inhabitant per year is 4,043 euros; seven times less than in the richest neighbourhood of Barcelona.
The second poorest residents of Catalonia are those living on 4,497 euros per year in the Maria de Déu de Montserrat neighbourhood of El Prat de Llobregat, between the industrial estate of Les Salines and the airport.
The second richest municipality is also located in the metropolitan area of Barcelona, the coastal neighbourhoods of Gavà Mar and the beach area of Castelldefels. The residents of Esplugues de Llobregat, Les Corts, Les Tres Torres and Pedralbes complete the 'top' Catalan districts with most income. They earn in a year more than double the average Catalan income. Municipalities such as Arenys de Mar or neighbourhoods such as Poble Sec in Barcelona match that Catalan average of 12,976 euros per year or almost 1,100 euros gross per month.
Sources
The map of the income per person in Barcelona, street by street (El Periodico)
The map of the income of the Spaniards, street by street (El Pais)
Wealth map of Spain: These are the country’s richest and poorest areas (El Pais, in English)


