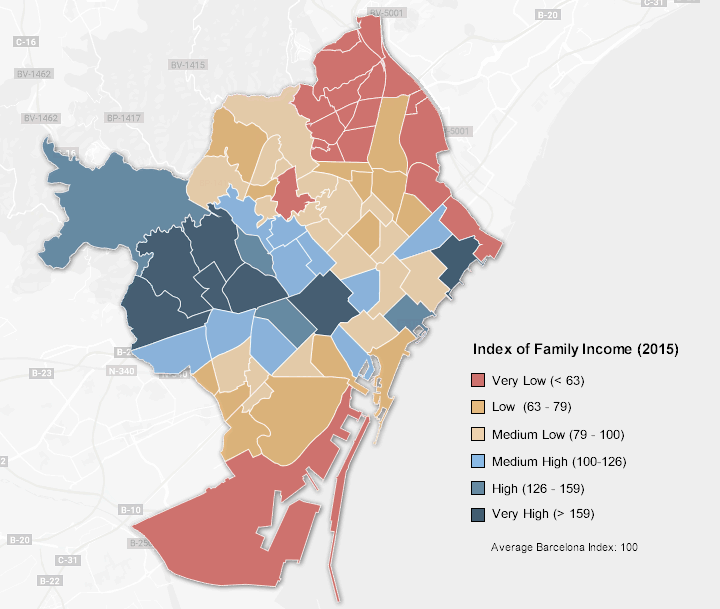
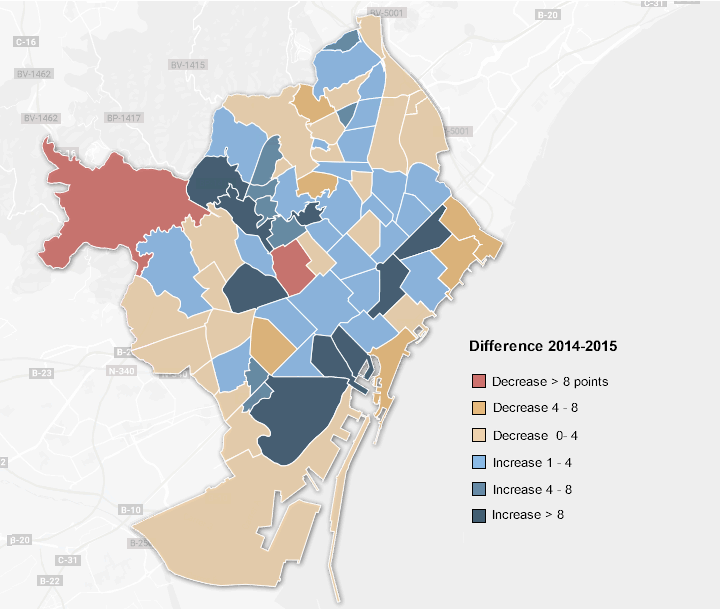
Map of family income inequalities in the districts of Barcelona 2014-2015
 2015 Family Income Index
 2014-2015 Changes
|
In 2015 the growth of inequalities between neighbourhoods in Barcelona slowed for the first time in eight years. The municipal report on the Territorial Distribution of Family Income Available per capita in Barcelona estimates that the average income of the city's families increased by around 3% during 2015.
Pedralbes is the neighbourhood with the highest income with an index of 250.5, compared with the Barcelona average of 100. The district of El Raval has improved from an index of 65.9 (2014) to 75.8 (2015) in general through the arrival of residents with more resources than usual.
The economic differences between the neighbourhoods accentuated by the economic crisis have stabilised. Nou Barris is still the district with least income, but its fall has slowed. At the extremes of this ranking, Pedralbes remains for the fifth consecutive year as the neighbourhood with the highest income with an average income 7.2 times higher than that of a resident of Ciutat Meridiana.
Almost all neighbourhoods with very low incomes are peripheral and have low population. The ten districts with the highest income have an average population 2.5 times higher than the ten with the lowest income.
The Ciutat Vella, which includes El Raval, continues to grow and consolidate as a middle-income district. This has progressed in recent years, advancing on other neighbourhoods in the rankings. However, more recent data shows a gradual decline in El Raval since 2015, with family income indexes of 74.6 in 2016 and 71.2 in 2017.
The report states that the average gross family income in Barcelona was 19,775 euros per year in 2015, 2.9% more than in 2014, and corresponding to 44.2% of the population. The reasons for this change in trend, are 'the strengthening of the economic situation in Barcelona and the increase in employment'.
Map of income per person in Barcelona street by street (2016)
Deprivation and Poverty in Barcelona
